
Office365 AddIns for R (Part I)
Introduction
I’d like to introduce a couple of Office365 add-ins for R that I have been working on recently. I read R-bloggers regularly and I thought these add-ins might be somewhat useful. The ExcelRAddIn lets you evaluate R scripts in an Excel worksheet. The RScriptAddIn for Word allows you to run an R script ‘inline’ from within a Word document. In this post and the following one Office365 AddIns for R (Part II), I will describe using both add-ins, and outline some of the caveats.
ExcelRAddIn
In this example we are going to work through a simple linear model. After opening Excel and loading the add-in (ExcelRAddIn-AddIn64.xll), begin a blank worksheet. You should see an R AddIn menu with a Settings button.
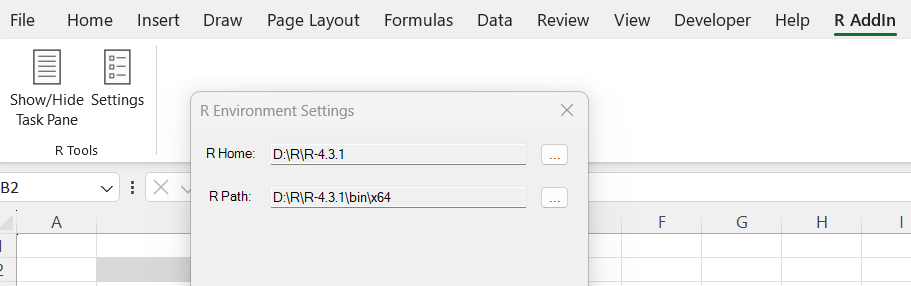
Ensure that the R Home and R Path are set correctly for your R installation.
Then, in a cell (e.g. B3), enter the R script library(tidyverse). In cell D3, enter the following: =RScript.Evaluate(B3, "true").
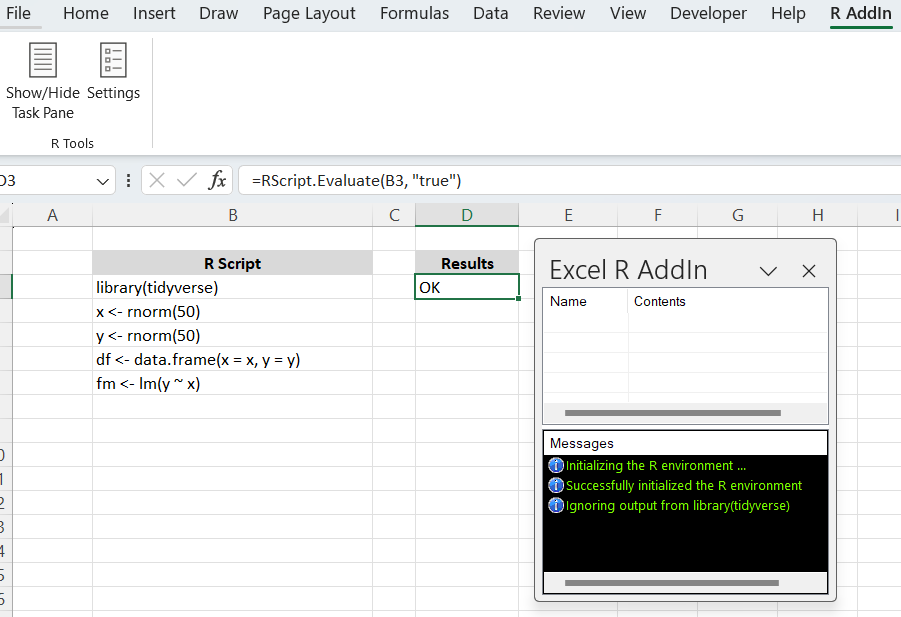
If this is the first call to RScript.Evaluate, the ExcelRAddIn Task Pane will display a couple of messages indicating that the R environment has been initialized. If there is an issue (for example, the path to the R directory has not been found) a message will appear here. Following this, the script will be executed. This will load the tidyverse package and dependencies. R would normally return a list of the libraries loaded. However, the second parameter in the RScript.Evaluate call suppresses the list (because it is not very interesting).
Continuing with the R script, enter the following in the cells below B3:
x <- rnorm(50)
y <- rnorm(50)
df <- data.frame(x = x, y = y)
fm <- lm(y ~ x)
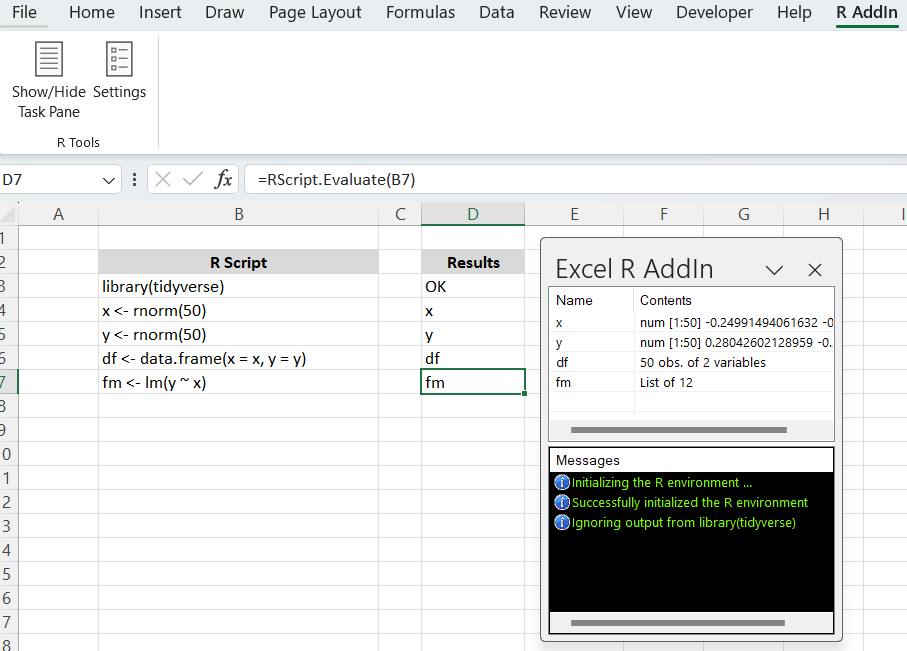
In the cells below D3, enter =RScript.Evaluate(B4) and so on. After each execution, the Task Pane displays the contents of the R environment, and the results can be viewed by calling RScript.Evaluate(...).
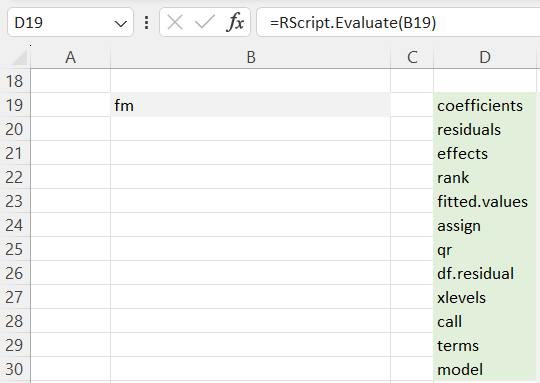
For example, to unpack the contents of the fitted model ‘fm’, simply call =RScript.Evaluate('fm'). This will list the names (if there are any) that can be used to subset the results.
Getting the model summary is slightly more involved. If we simply call =RScript.Evaluate("summary(fm)"), we just get the list of names, which is ok. From this, we can pull out sigma, r-squared, and so on.
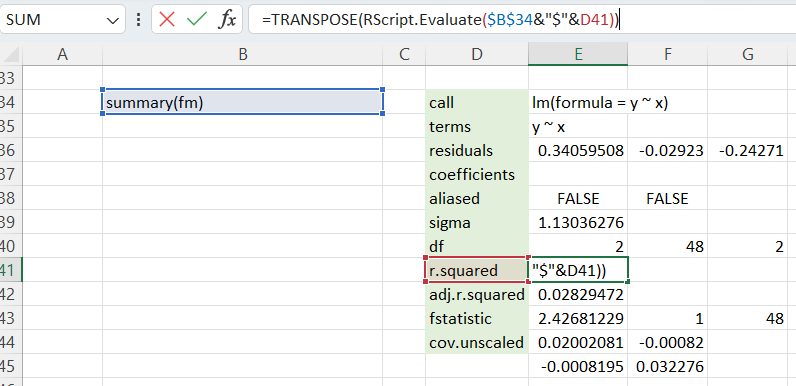
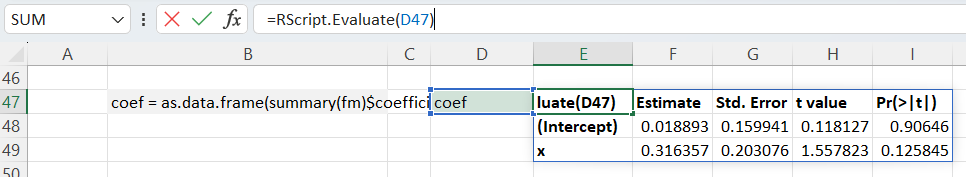
However, the coefficients are returned as an unlabelled array, so we convert this to a data frame using the script coef = as.data.frame(summary(fm)$coefficients) and evaluate this. The resulting ‘coef’ object can then be displayed.
With a small amount of effort it is possible to create a flexible dashboard to summarize the results.
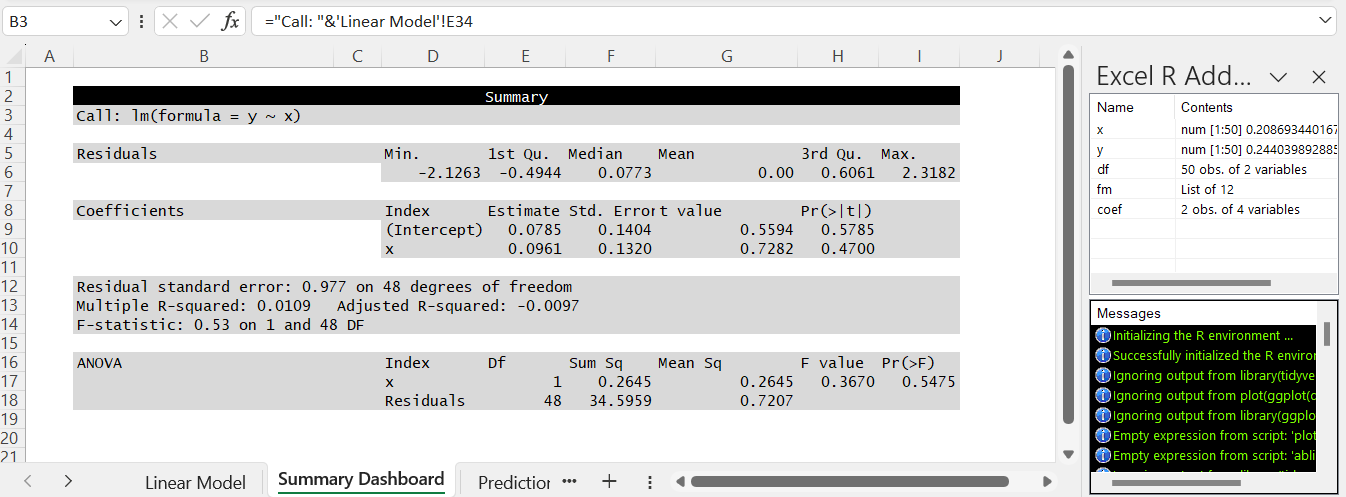
This example (from a different session) more-or-less emulates the output produced in RStudio from executing summary(fm).
We can also create graphs, for example by calling plot(x, y) and evaluating it. The R graphics window opens and we can copy the graphic as a metafile (or bitmap) into the worksheet. If we keep the graphics window open we can evaluate further graphics commands. For example, we can call abline(coef(fm)) to add a line-of-best-fit. When we are finished with the graphics commands we can close the graphics window. It is possible to use ggplot2 if the script is wrapped in a call to plot, for example: plot(ggplot(df, aes(x = x, y = y)) + geom_point()). I’m still investigating why this is so.
Wrap-up
That covers the basic usage. Beyond this, there are 3 other functions available in the ExcelRAddIn: CreateVector, CreateMatrix, and CreateDataFrame. These can be used to take data sets from Excel and add them to the R environment.
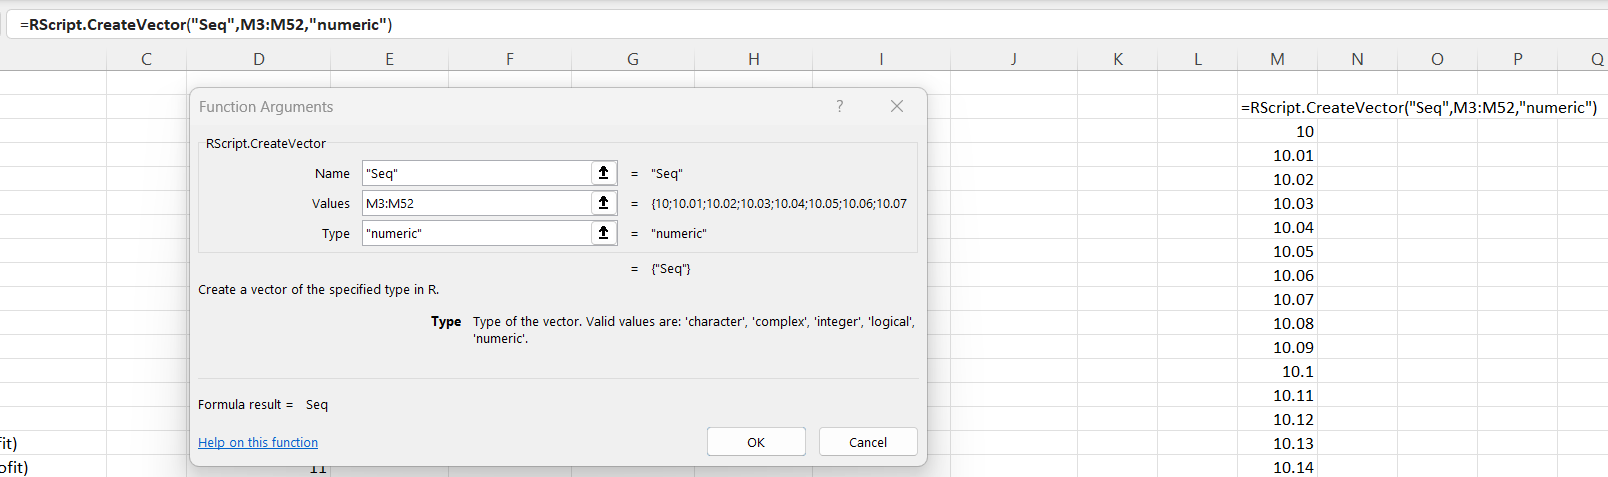
As can be seen from the screenshot, you need to specify a type for the vector or matrix. In the case of CreateDataFrame, you need to pass an array of types for the corresponding columns. This is not ideal, and I am looking for less clumsy alternatives.
Datasets from R can be loaded into Excel by evaluating the R script (for example iris_data <- datasets::iris). The GitHub repository Office365Addins contains a number of sample spreadsheets that exercise various features.
The projects are still in an ‘alpha’ stage, meaning you will need to download the project from GitHub Office365Addins, build the Visual Studio solution, and install or run it directly from Visual Studio.
Comments