
Consuming yfinance data in Excel - Part II
Introduction
The first part of this two-part blog described the YFinanceService. This is a Flask service that wraps calls to the Python yfinance library and which served up some of the data via the APIs (/IntrinsicValue, /TickerData and so on). Part II of the blog describes how to make use of the APIs in an Excel spreadsheet, specifically using the Power Query Web Connector to retrieve the data.
Consuming the APIs from Excel
One of the main objectives of this project was to be able to obtain the data from yfinance via the YFinanceService and use it in Excel. For this, we use the Stock Valuation Spreadsheet.
The spreadsheet uses the Power Query Web Connector. However, rather than using the Web Connector directly to call our YFinanceService APIs, we use Power Query to create blank queries and write the Power Query M language code to obtain the parameters from the worksheets and to process the results into a table.
The spreadsheet consists of the following worksheets:
- Setup - defines a table (
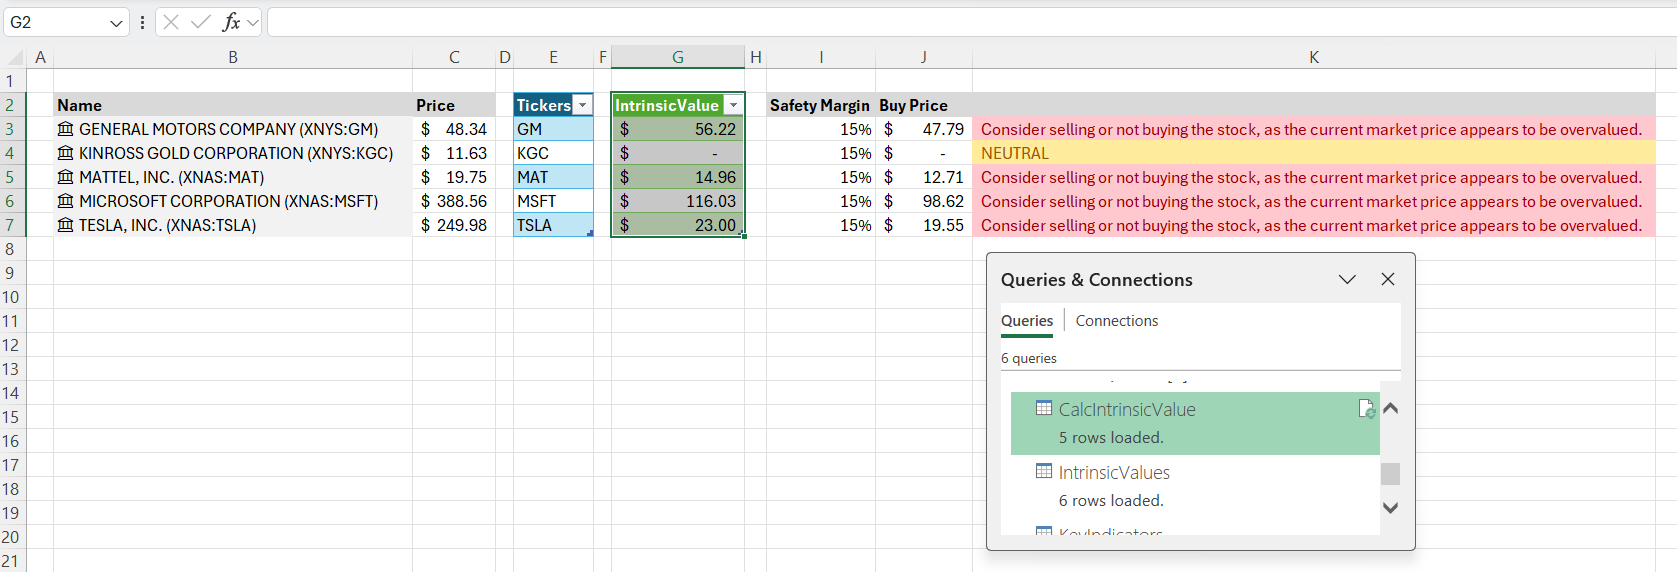
Parameters) with global model parameters (average yield and current yield). This table is passed into the Power Query queries when needed. - Screener - this sheet obtains the current prices for a number of stocks and calculates the intrinsic value for each, displaying a recommendation alongside the computed safety margin. The margin of safety is discussed in the article How to Calculate the Intrinsic Value of a Company Like Benjamin Graham.
- IntrinsicValues - this sheet defines a list of tickers and requests the intrinsic values for all of them. Similar to the above, it displays a recommendation alongside the computed safety margin.
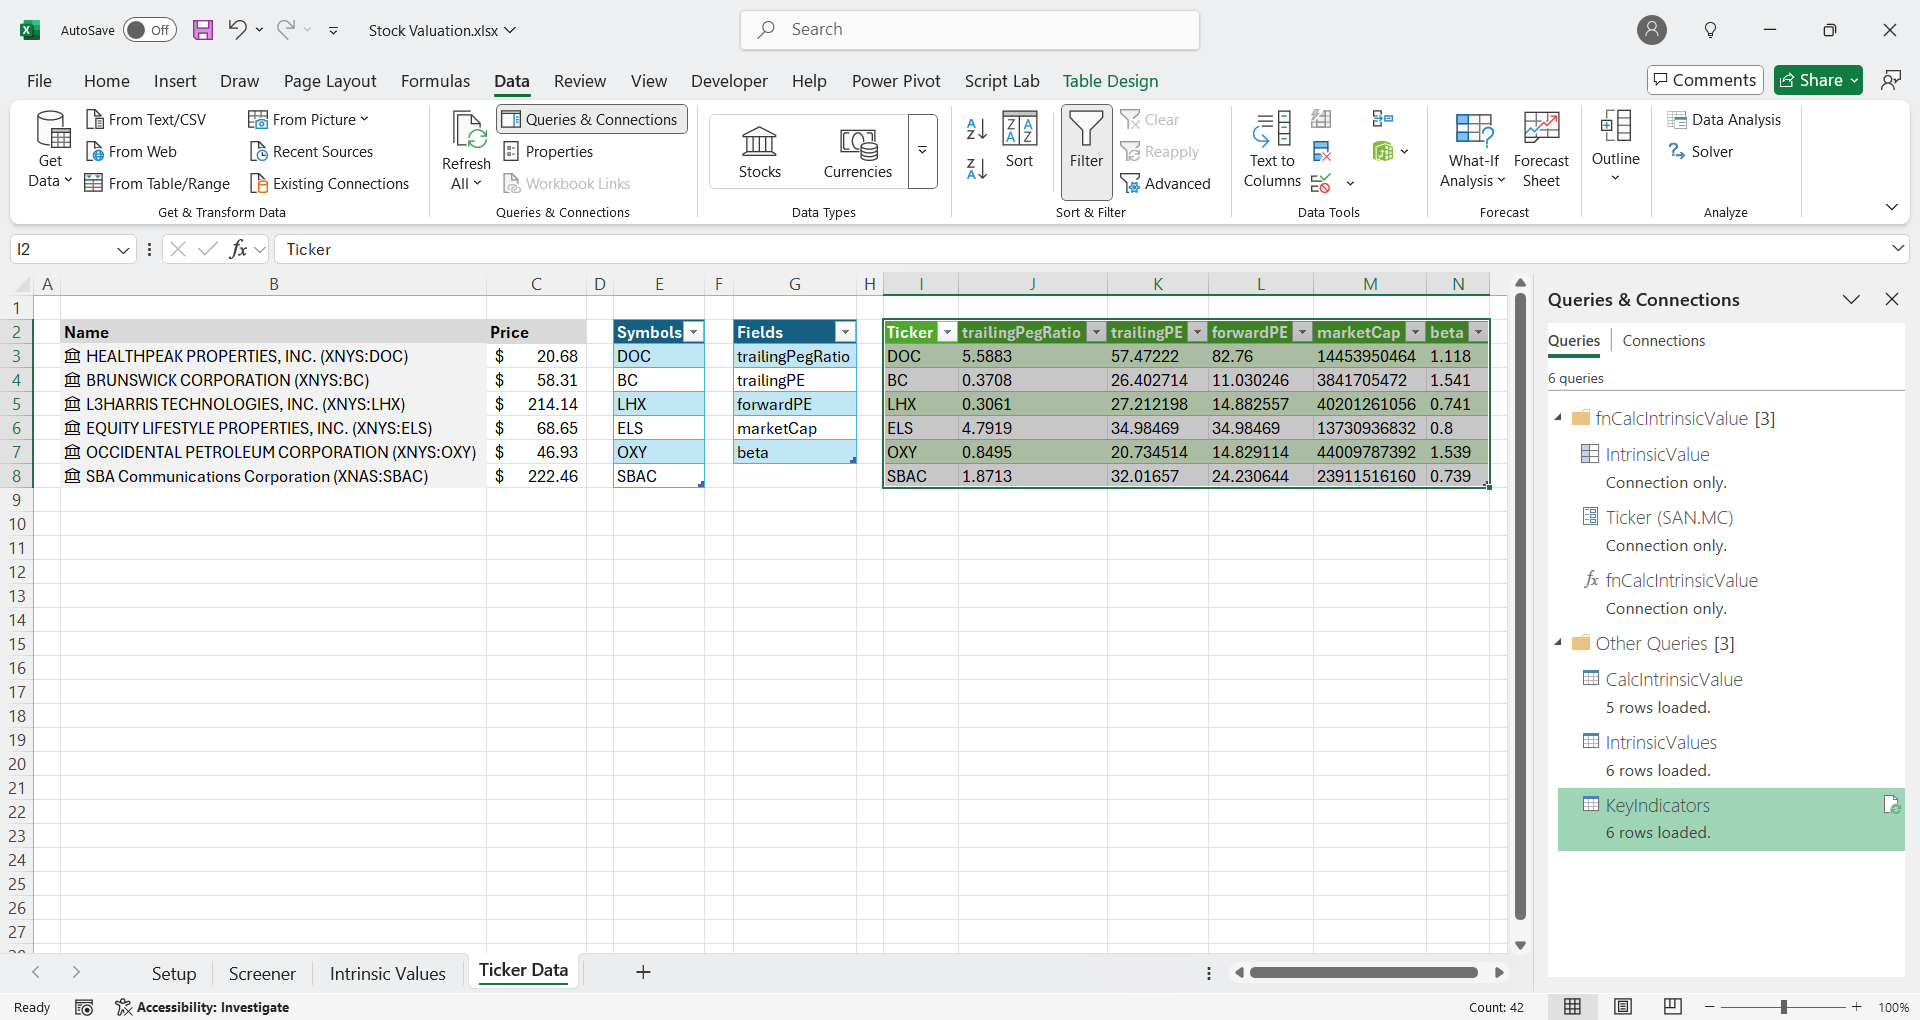
- Ticker Data - this sheet requests a number of key indicators for a list of stock tickers and displays the results.
After opening the spreadsheet, select the Setup worksheet and from the Data menu select Queries and Connections. This will list the queries that are used in this sheet. The three main queries are:
KeyIndicators(in the TickerData worksheet)IntrinsicValues(in the IntrinsicValues worksheet)CalcIntrinsicValuewhich depends on the functionfnCalcIntrinsicValue(in the Screener worksheet)
KeyIndicators Query
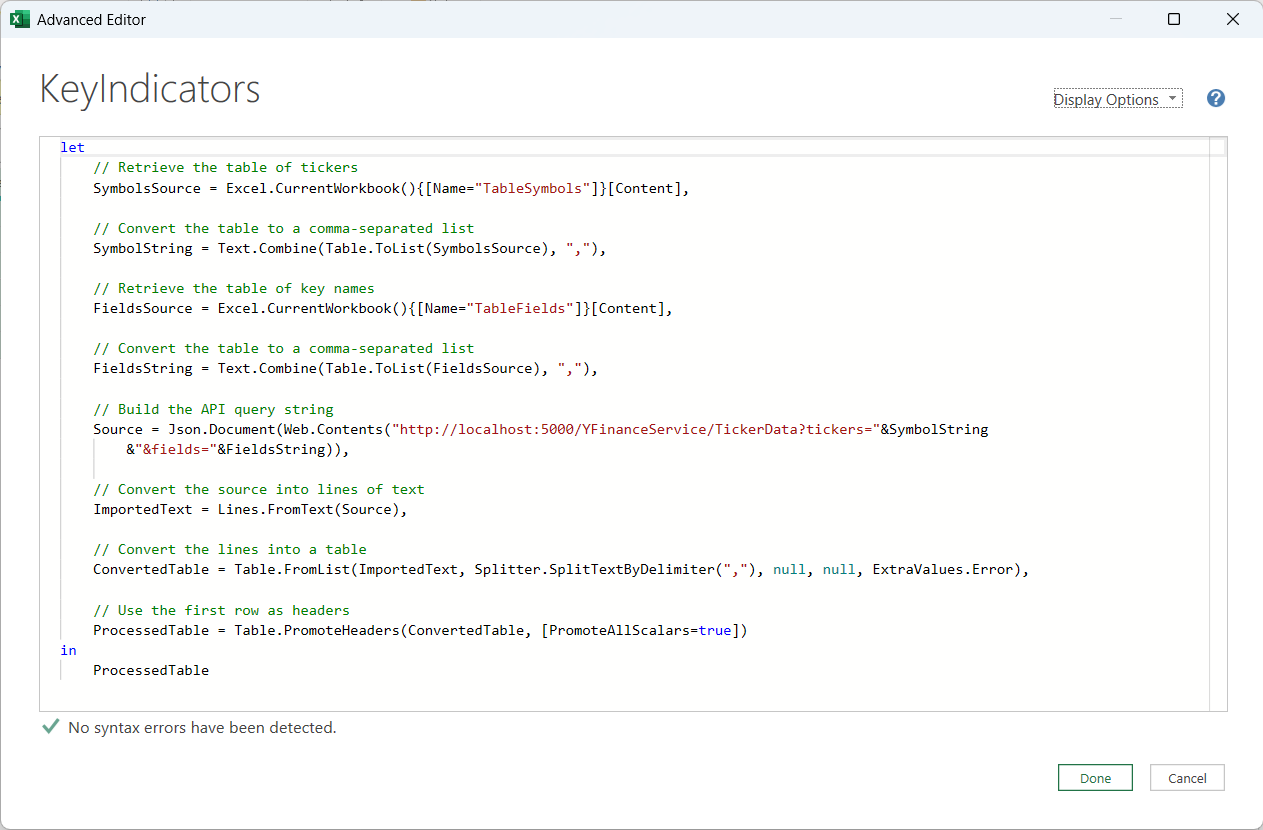
The TickerData worksheet sets up two tables: TableSymbols and the TableFields. These are used as the inputs to the KeyIndicators query. The Power Query M code builds up the API query string from these inputs and processes the result to produce a table. The query can be refreshed using the refresh symbol on the right-hand side of the Queries & Connections panel.
IntrinsicValues Query
The IntrinsicValues worksheet sets up a table called TickerList. Additionally the query obtains the values for the average yield (avg_yield) and the current yield (cur_yield) from the parameters table defined in the Setup worksheet. With these values it constructs the API query string and calls the appropriate YFinanceService. If the query succeeds, the resulting string is processed into a table with two columns: Ticker and Intrinsic Value.
CalcIntrinsicValue Query
The CalcIntrinsicValue query depends on the fnCalcIntrinsicValue query/function. This in turn depends on a query (IntrinsicValue) which has had a parameter (Ticker) added to it. The parameter is added using the Manage Parameters menu on the Home menu strip. Once the parameter is added we can convert the original query to a function - fnCalcIntrinsicValue. The function can be invoked either by double clicking it or by entering a parameter, the ticker symbol in this case, and pressing “Invoke”. However, we will not use this method of calling the function.
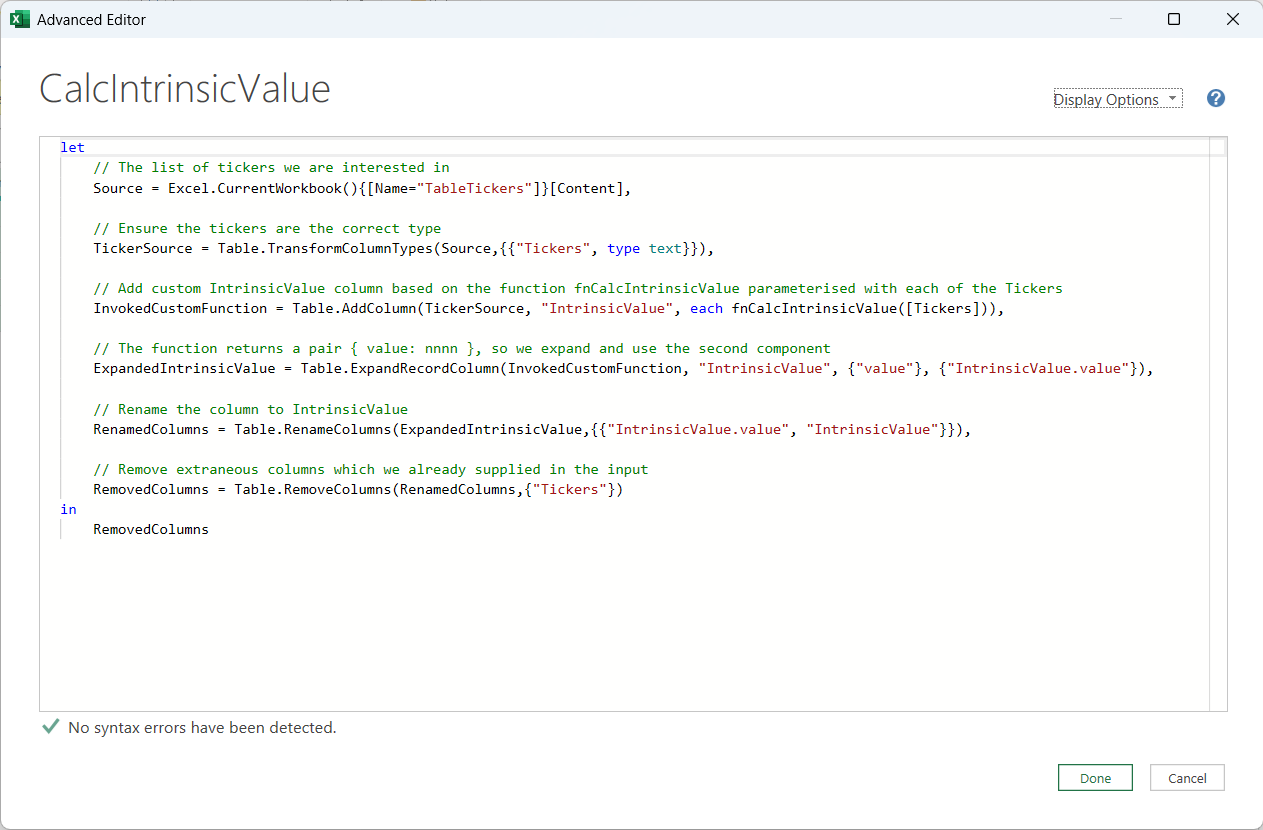
Instead, we create a further query CalcIntrinsicValue. This creates a new table. The table uses the tickers defined in the TableTickers (input) table and adds a new custom column. The custom column invokes the intrinsic value function for each ticker value.
	// Add custom IntrinsicValue column based on the function fnCalcIntrinsicValue parameterised with each of the Tickers
    InvokedCustomFunction = Table.AddColumn(TickerSource, "IntrinsicValue", each fnCalcIntrinsicValue([Tickers])),
The function fnCalcIntrinsicValue returns a key-value pair { value: nnnn }, so we expand the result and use only the second component:
ExpandedIntrinsicValue = Table.ExpandRecordColumn(InvokedCustomFunction, "IntrinsicValue", {"value"}, {"IntrinsicValue.value"}),
The resulting table is processed to display on the Intrinsic Value column (which is what appears in the worksheet).
A word about performance
Overall the performance of the queries is slow. Assuming the YFinanceService is already running, and the Excel spreadsheet is open. Then, pressing the refresh button on any of the queries needs to 1) construct a query string, 2) call the API via Web.Contents, and 3) process the results. The call via Web.Contents calls a Flask API which wraps Python code, and in this case calls via yfinance and yahoo_fin. Both these use web scraping and this is what determines the slow performance.
Wrap Up
In Part I we described the YFinanceService and the API calls to the Python yfinance library. Part II described how to make use of the APIs in an Excel spreadsheet, specifically using the Power Query Web Connector to retrieve the data.
Overall the arrangement that we have is:
- The YFinanceService API query (“What is the intrinsic value of this stock using Graham’s formula?”) takes its parameters and inputs from an Excel table and invokes the stock valuation function via the Power Query Web Connector.
- The calculation is done in Python using data from the yfinance library.
- The result is served up over Flask endpoints (the API).
- The result data is massaged using the Power Query Web Connector and used in the Excel worksheet for additional calculations.
Advantages and Disadvantages
There are advantages and disadvantages to this approach. The main advantages are:
- it is simple to debug (on the Python side); somewhat less so using the Power Query M language.
- it is relatively simple to extend: you can add more functionality on the Python side, and/or extend the Flask API to support additional endpoints that expose more of the data from yfinance. The disadvantages are mainly concerned with the performance.
- the performance is somewhat disappointing. Specifically, in this case we needed some data from another finance package yahoofinance. The underlying mechanism requires web-scraping specific yahoo finance pages (and tables and elements etc.) which results in relatively slow performance.
Comments