
Building a Flask service to get yfinance data - Part I
Introduction
Recently, I’ve been doing some portfolio analysis and I came across an interesting video: How to Calculate the Intrinsic Value of a Stock like Benjamin Graham. Since not all the data is available in Excel, I thought it might be useful to automate the calculation using data from the (excellent) yfinance Python library. The formula itself, written in Python, is quite simple. The challenge was to obtain the individual parameters and inputs and be able to call the Python function from an Excel worksheet.
It would have been nice to be able to use Excel’s Python support PY=. But it turns out that importing yfinance produces a module not found error.
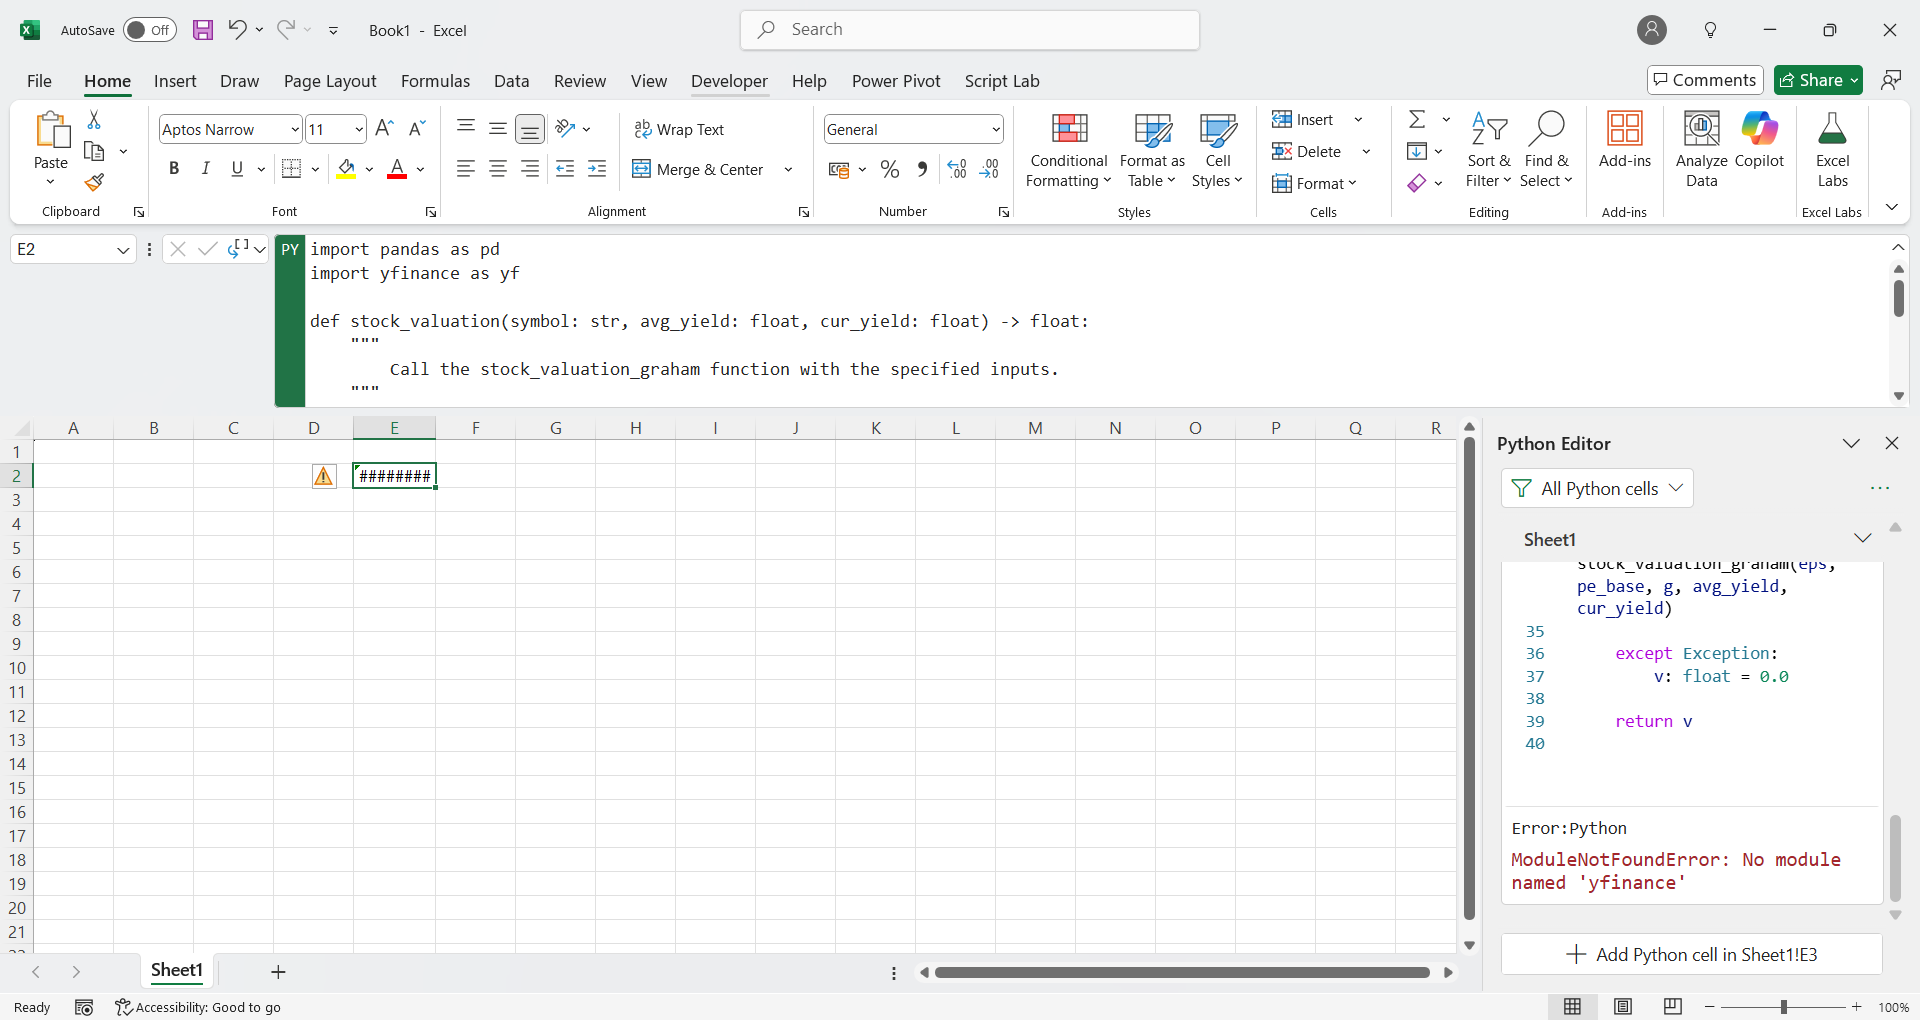 .
.
According to the documentation yfinance is not one of the open source libraries that the Excel Python secure distribution supports.
So, in order to bridge the gap between Excel and Python I thought it might be a good idea to write a Flask API. This arrangement allows us access to Python’s ecosystem, and provides a (relatively) simple means by which we can consume the data in Excel using the Power Query Web Connector.
This blog is divided into two parts. In Part I, I describe the YFinanceService. This is a basic Flask service with APIs to perform the stock valuation calculation and more generally to obtain ticker data using yfinance.
In Part II, I describe how to use the YFinanceService from Excel Power Query to automate the process of performing a stock valuation calculation and to obtain a simple table of ticker data.
There are several alternative approaches. One could try a custom Python add-in for Excel. If you have non-financial data perhaps use Excel’s built-in Python support. The approach adopted here is a simple and quite generic way to have access to Python and its ecosystem. It allows you to obtain data and invoke / perform calculations.
Calculate the intrinsic value of a stock using Graham’s formula
In general, calculating stock values is quite involved. There are a number of different methods each with their advantages and disadvantages. For example Simply Wall St. describes a number of more complicated approaches. The approach adopted here is to use Graham’s formula to calculate the intrinsic value of a stock with a view to determining whether it is cheap or expensive compared to its current price. The Python code is as follows:
"""
Estimates the intrinsic value of a stock
"""


def stock_valuation_graham(eps: float, pe_base: float, g: float, avg_yield: float, cur_yield: float) -> float:
    """
    Calculate the intrinsic value of a stock using Graham's formula
    Reference: https://stablebread.com/how-to-calculate-the-intrinsic-value-of-a-company-like-benjamin-graham/

        V = (eps * (pe_base + 2g) * avg_yield) / cur_yield

    where:
    V = intrinsic value per share (over the next 7-10 years)
        EPS = earnings per share (over the trailing twelve months (TTM))
        8.5 = price-to-earnings (P/E) base for a no-growth company
        g = reasonably expected annual growth rate (over the next 7-10 years)
        avg_yield = average yield of AAA Corporate Bonds
        cur_yield = current yield of AAA Corporate Bonds
    """

    V = (eps * (pe_base + 1.1 * g) * avg_yield) / cur_yield

    return V
The formula itself is self-explanatory. A more detailed explanation of the calculation is available here. The parameters are divided into those values that we obtain per ticker and some global values. Thus, the EPS and the expected annual growth rate are obtained from the ticker info using yfinance. On the other hand, the average yield of AAA Corporate Bonds, and the current yield of AAA Corporate Bonds are setup as input parameters.
Finally, both the price-to-earnings (P/E) base for a no-growth company and the factor applied to the expected annual growth are hardcoded. The price-to-earnings (P/E) base for a no-growth company is established at 8.5. The factor applied to the expected annual growth - 2g seemed somewhat aggressive so we lower our expectations to 1.1g. Later, both these values may be set up as input parameters.
The YFinanceService
The YFinanceService consists of four main APIs (endpoints):
- TickerInfo
- TickerData
- IntrinsicValue
- IntrinsicValues
These are declared in YFinanceService.py.
# Flask application
app = Flask(__name__)
api = Api(app)

# Register Endpoints
api.namespace('YFinanceService', description='YFinance Service API')

api.add_resource(VersionInfo, '/YFinanceService/VersionInfo')
api.add_resource(TickerInfo, '/YFinanceService/TickerInfo')
api.add_resource(TickerData, '/YFinanceService/TickerData')
api.add_resource(IntrinsicValue, '/YFinanceService/IntrinsicValue')
api.add_resource(IntrinsicValues, '/YFinanceService/IntrinsicValues')


if __name__ == '__main__':
    DEBUG = False
    HOST = environ.get('SERVER_HOST', 'localhost')
    try:
        PORT = int(environ.get('SERVER_PORT', '5000'))
    except ValueError:
        PORT = 5000
    # run our Flask app
    app.run(HOST, PORT, DEBUG)
Running the YFinanceService
The YFinanceService can be run from the command line. Locate the \YFinanceService subdirectory. At the command prompt, type python YFinanceService.py. Alternatively, the service can be run directly with the debugger from within VSCode.
You should see a message similar to the following:
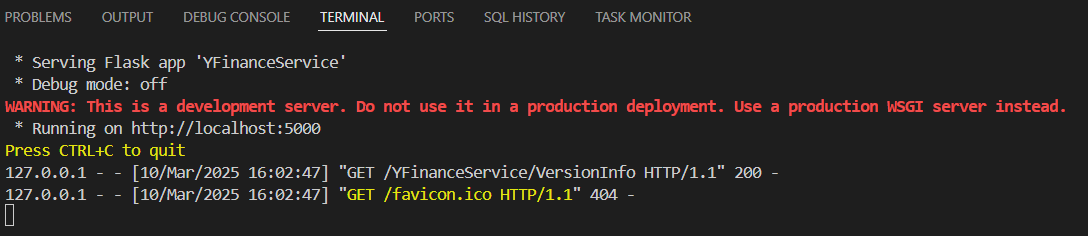
To test the service from a browser, type the following in the address bar:
http://localhost:5000/YFinanceService/VersionInfo
and you should see the json response packet: {"VersionInfo": {"flask": "3.1.0", "yfinance": "0.2.54", "pandas": "2.2.3"}}
YFinanceService Endpoints
With the service running, the API endpoints can be exercised via a browser using the examples below (assuming the service is running on port 5000).
IntrinsicValue API
The Flask API IntrinsicValue only supports the GET method. The other REST methods (PUT, POST, etc.) are not defined. The GET API takes three parameters:
- ticker - The ticker symbol
- avg_yield - The average yield of AAA Corporate Bonds
- cur_yield - The current yield of AAA Corporate Bonds
The GET function is divided into two parts. The first part obtains the (required) parameters. The second part calls a wrapper function stock_valuation.
class IntrinsicValue(Resource):
    """ Calculate the intrinsic value of a single stock using Graham's formula. """
    def get(self):

        parser = reqparse.RequestParser()

        parser.add_argument("ticker", type=str, required=True, help="The ticker symbol of the stock")
        parser.add_argument("avg_yield", type=float, required=True, help="Average yield of AAA Corporate Bonds")
        parser.add_argument("cur_yield", type=float, required=True, help="Current yield of AAA Corporate Bonds")

        args = parser.parse_args()

        symbol: str = args.get("ticker")
        avg_yield: float = args.get("avg_yield")
        cur_yield: float = args.get("cur_yield")

        v: float = stock_valuation(symbol, avg_yield, cur_yield)

        return {"value": v}, 200  # return info and 200 OK code
The stock_valuation function obtains the ticker.info dictionary from yfinance, and uses this to get the trailing EPS. The price-to-earnings (P/E) base for a no-growth company is hardcoded at 8.5. The expected growth rate g is obtained from the Yahoo finance stock info library. Finally, the stock_valuation_graham function is called with all the required parameters and the intrinsic value is returned.
For example, to determine the instrinsic value of GM we can use the following query: http://localhost:5000/YFinanceService/IntrinsicValue?ticker=GM&avg_yield=4.25&cur_yield=3.25.
This returns a dictionary with a single value: {“value”: 82.07549}. Comparing this to the current price of GM (46.72), we might conclude that the stock is undervalued.
The stock_valuation function is also used by the IntrinsicValues API. This does the same as the IntrinsicValue API but for a list of tickers. For this reason, the stock_valuation function handles any errors and exceptions and returns 0.0 for example if a ticker is not found or the data item is not available. If this had been part of a web application, we might have returned an error code and some exception message via the API into an HTML page. However, in this arrangement, the client is Excel, and specifically the Power Query Web Connector. So to simplify the client (Excel) processing we have tried to make the API calls as resilient as possible.
For example, the following: http://localhost:5000/YFinanceService/IntrinsicValues?tickers=SAN.MC,BBVA.MC,IBE.MC,AENA.MC&avg_yield=3.25&cur_yield=1.25 queries for the intrinsic values of four Spanish stocks. The results are returned as a comma-separated table with two columns: the ticker and the intrinsic value.
TickerData API
The Flask API TickerData also only supports the GET method. The purpose of the API is to retrieve one or more fields from the yfinance ticker info for a given list of ticker symbols. The output is a csv string that can be parsed into a table with the column headers being the field names and the rows being the data corresponding to each ticker.
class TickerData(Resource):
    """ Retrieve the specified fields from the input tickers """
    def get(self):

        parser = reqparse.RequestParser()

        parser.add_argument("tickers", type=str, action='split', required=True, help="One or more ticker symbols")
        parser.add_argument("fields", type=str, action='split', required=True, help="One or more fields")

        args = parser.parse_args()

        symbols: list = args.get("tickers")
        fields: list = args.get("fields")

        headers: list = ['Ticker']
        for field in fields:
            headers.append(field)

        rows: list = []

        try:

            for symbol in symbols:
                rows.append(get_items(symbol, fields))

        except Exception:
            print("An error occured")

        df = pd.DataFrame(rows, columns=headers)

        return df.to_csv(index=False, header=True), 200  # return info and 200 OK code
As previously described, the API is divided into two parts. The first part obtains the parameters, checks that the required parameters are present and sets up the table headers. The second part iterates over the input list of ticker symbols and for each symbol requests the data items from the ticker.info structure. Each row is appended to a list of rows. Finally, the csv table is returned using the DataFrame.to_csv method.
The parameters are a comma-separated list of ticker symbols and a comma-separated list of fields (key names in the ticker.info dictionary). This provides a relatively flexible way to obtain stock financial data.
For example to obtain the following indicators:
- trailingPegRatio
- trailingPE
- forwardPE
for the symbols: MSFT, AMZN, WAL and TSLA we can create the following query: http://localhost:5000/YFinanceService/TickerData?tickers=MSFT,AMZN,WAL,TSLA&fields=trailingPegRatio,trailingPE,forwardPE
As before, the error handling is resilient rather than informative. The table will be built with empty values if there is a problem obtaining the data, if the key doesn’t exist, or if the ticker symbol is unavailable and so on. This is not necessarily ideal but it simplifies the client processing.
Wrap Up
This blog has introduced the YFinanceService, a simple Flask service that defines some endpoints to allow us to perform a stock valuation calculation and more generally to obtain ticker data using the Python yfinance library. In Part II of the blog, I describe how to use the raw APIs in Excel via the Power Query Web Connector.
Comments